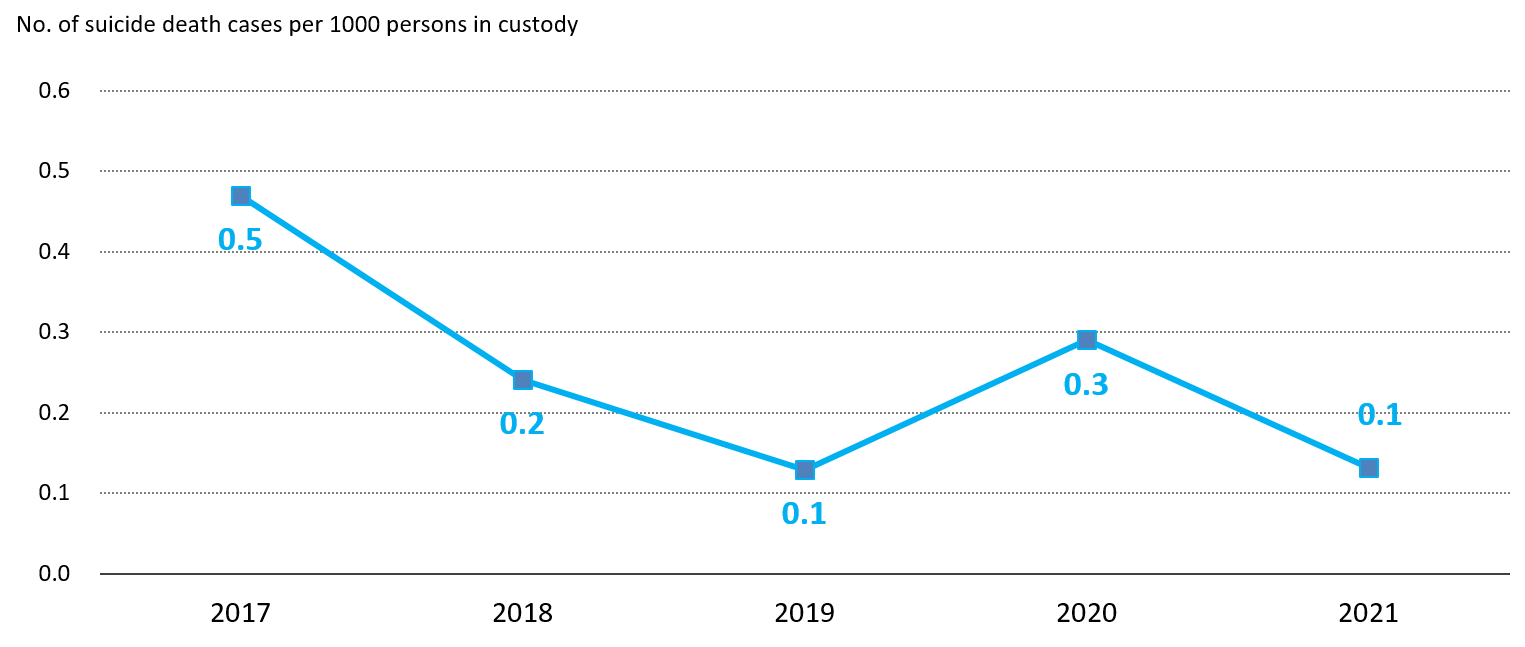
Suicide rate of persons in custody
Chart 1.9: Suicide rate of persons in custody

Table 1.12: Suicide rate of persons in custody
| 2017 | 2018 | 2019 | 2020 | 2021 | ||
| (a) | No. of suicide death cases | 4 | 2 | 1 | 2 | 1 |
| (b) | Average daily number of persons in custody | 8529 | 8303 | 7737 | 6902 | 7616 |
| (c) | No. of suicide death cases per 1000 persons in custody [ (c) = (a) / (b) x 1000 ] |
0.5 | 0.2 | 0.1 | 0.3 | 0.1 |
Download statistical table