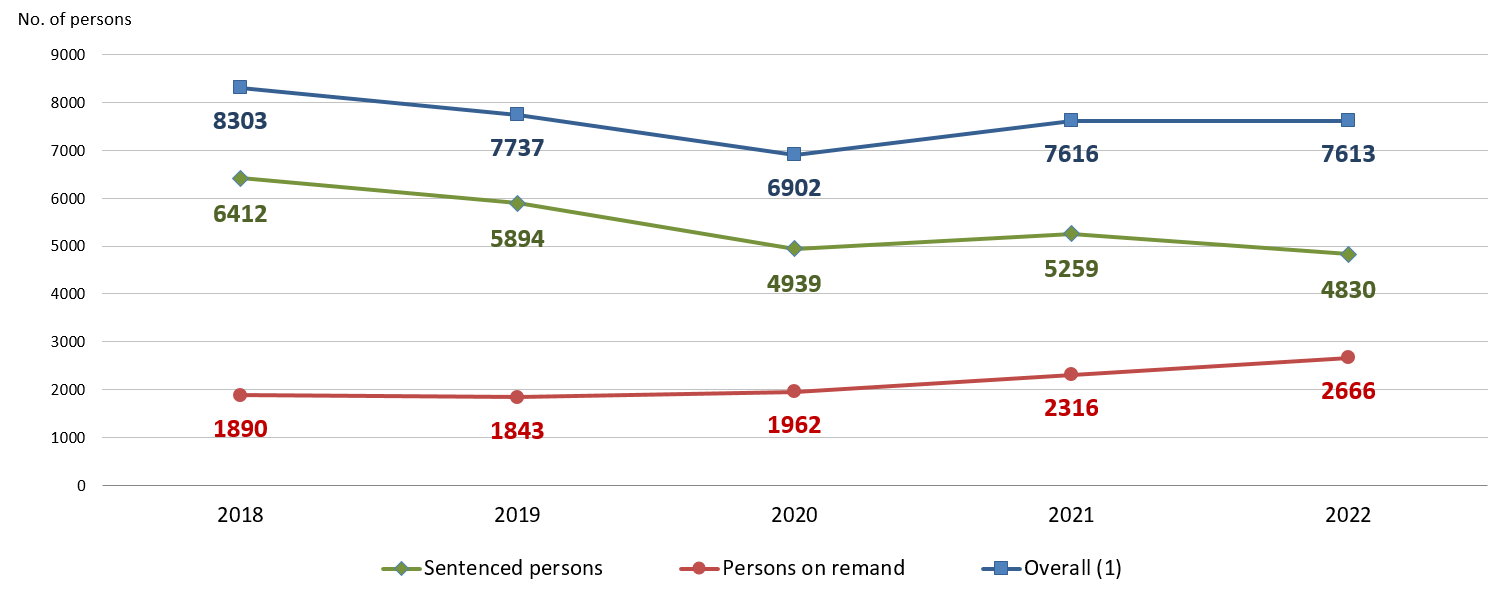
Average daily penal population
Chart 1.1: Average daily number of persons in custody by category

| Note: | (1) Including detainees. |
Table 1.1: Average daily number of persons in custody by category and gender
| Category | 2018 | 2019 | 2020 | 2021 | 2022 |
| (No. of persons) | (No. of persons) | (No. of persons) | (No. of persons) | (No. of persons) | |
| Sentenced persons | |||||
| Male | 5030 | 4633 | 3919 | 4128 | 3766 |
| Female | 1382 | 1261 | 1020 | 1131 | 1065 |
| Sub-total | 6412 | 5894 | 4939 | 5259 | 4830 |
| Persons on remand | |||||
| Male | 1594 | 1548 | 1666 | 1935 | 2292 |
| Female | 296 | 295 | 296 | 380 | 374 |
| Sub-total | 1890 | 1843 | 1962 | 2316 | 2666 |
| Overall (1) | |||||
| Male | 6624 | 6181 | 5586 | 6105 | 6175 |
| Female | 1678 | 1556 | 1317 | 1511 | 1439 |
| Total | 8303 | 7737 | 6902 | 7616 | 7613 |
| Notes: | There may be a slight discrepancy between the sum of individual items and the respective totals as shown in the above due to rounding. |
| (1) Including detainees. |
Download statistical table