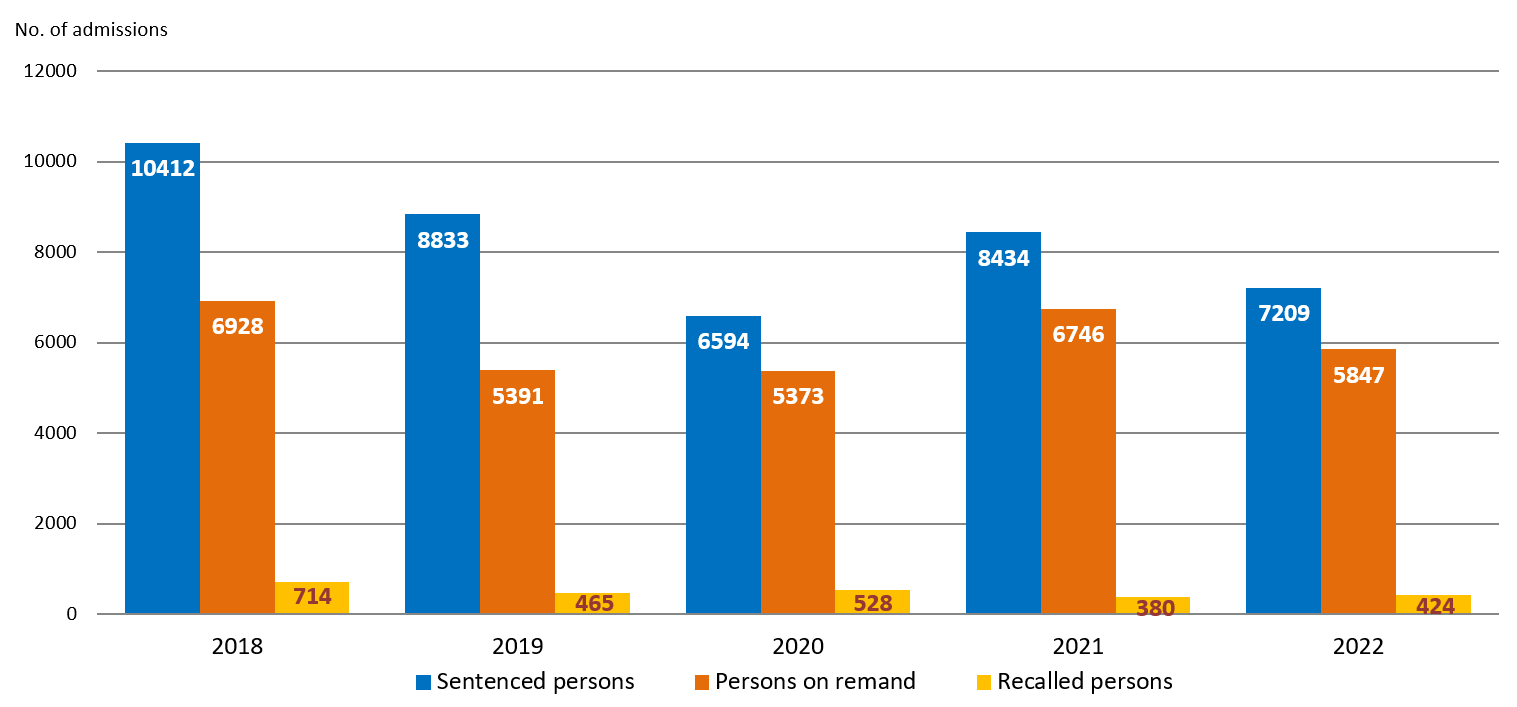
Admissions of persons in custody to correctional institutions
Chart 1.4: Admission of persons in custody to correctional institutions by category

Table 1.5: Admission of persons in custody to correctional institutions by category and gender
| Category | 2018 | 2019 | 2020 | 2021 | 2022 |
| (No. of admissions) | (No. of admissions) | (No. of admissions) | (No. of admissions) | (No. of admissions) | |
| Sentenced persons | |||||
| Male | 7 253 | 6 134 | 4 779 | 6 325 | 5 316 |
| Female | 3 159 | 2 699 | 1 815 | 2 109 | 1 893 |
| Sub-total | 10 412 | 8 833 | 6 594 | 8 434 | 7 209 |
| Persons on remand | |||||
| Male | 5 427 | 4 241 | 4 284 | 5 287 | 4 631 |
| Female | 1 501 | 1 150 | 1 089 | 1 459 | 1 216 |
| Sub-total | 6 928 | 5 391 | 5 373 | 6 746 | 5 847 |
| Recalled persons | |||||
| Male | 568 | 379 | 438 | 294 | 359 |
| Female | 146 | 86 | 90 | 86 | 65 |
| Sub-total | 714 | 465 | 528 | 380 | 424 |
| Overall | |||||
| Male | 13 248 | 10 754 | 9 501 | 11 906 | 10 306 |
| Female | 4 806 | 3 935 | 2 994 | 3 654 | 3 174 |
| Total | 18 054 | 14 689 | 12 495 | 15 560 | 13 480 |
Download statistical table
Table 1.6: Admission of sentenced persons to correctional institutions by type of offence
| Type of offence | 2018 | 2019 | 2020 | 2021 | 2022 |
| (No. of admissions) | (No. of admissions) | (No. of admissions) | (No. of admissions) | (No. of admissions) | |
| Burglary, theft and handling stolen goods | 2 281 | 1 975 | 1 941 | 1 980 | 1 467 |
| Immigration offences | 3 089 | 2 393 | 1 448 | 1 713 | 1 432 |
| Drug offences | 1 691 | 1 441 | 839 | 1 293 | 1 198 |
| Violent crime against person | 601 | 534 | 436 | 608 | 492 |
| Others | 2 750 | 2 490 | 1 930 | 2 840 | 2 620 |
| Total | 10 412 | 8 833 | 6 594 | 8 434 | 7 209 |
Download statistical table